
Containerized Seawater Desalination is attracting buyers who need dependable freshwater without building a large permanent plant. A packaged system can arrive with pumps, membranes, controls, and pretreatment equipment inside a standard container. At a coastal resort, remote worksite, or island community, this compact footprint can simplify installation. It does not make every project simple.
Yale environmental engineering professor Menachem Elimelech’s research highlights an essential consideration: desalination choices should account for energy use and environmental impacts, not water output alone. That is a useful lens for comparing suppliers. A vendor’s rated capacity matters, but so do feedwater conditions, power consumption, membrane replacement intervals, operator training, and service access. Details count. A specification sheet cannot show how a system performs when seawater quality changes or spare parts are delayed.
This guide introduces ten China-based suppliers for consideration, rather than treating any list as a definitive ranking. Buyers should verify each company’s manufacturing role, project references, certifications, and after-sales coverage directly. Ask for performance data under comparable conditions, including water recovery and product-water quality. Check what the quoted package excludes, such as intake works, storage tanks, or commissioning. Even a polished brochure can leave gaps. Supplier claims deserve careful review, and actual operating results may differ from design figures. With clear criteria, readers can compare options more fairly and identify systems suited to their site, budget, and operating capacity.
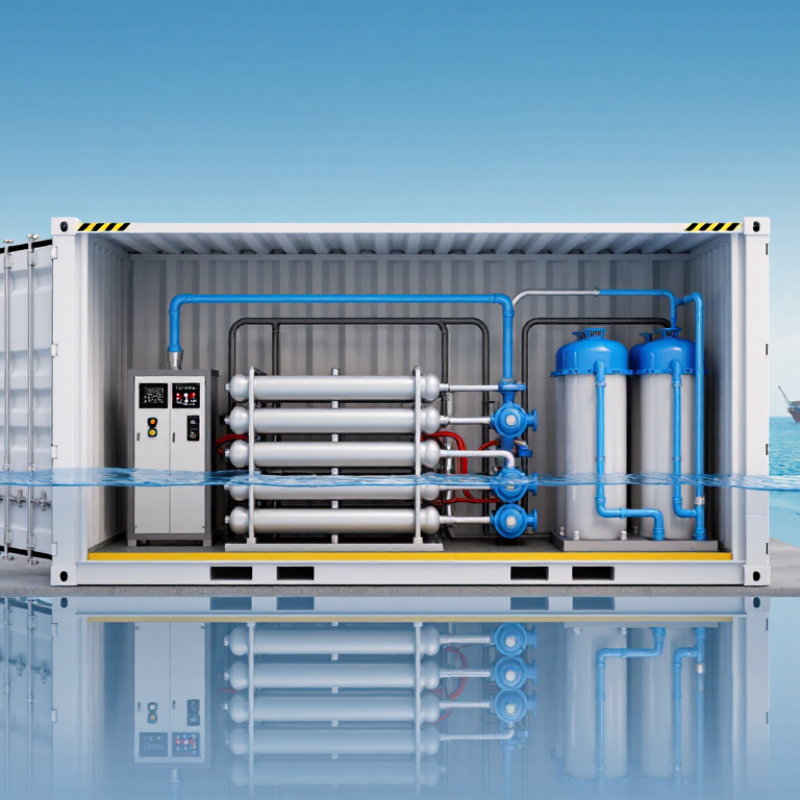
Seawater entering a containerized desalination plant is often described as having about 35 g/L of dissolved salts. That is a useful design reference, not a fixed promise. Coastal intake water shifts with tides, rainfall, river discharge, and seasonal plankton. Even a clear-looking sample can carry fine silt, organic matter, and microorganisms. These details influence pretreatment more than a headline salinity figure suggests. Small details matter.
In seawater reverse osmosis (SWRO), pretreatment protects the membranes from particles and biological fouling. Screening and filtration remove much of the suspended material before water reaches the high-pressure pumps. Those pumps push feed through semi-permeable membranes, which let water pass while retaining most dissolved salts. The resulting permeate usually needs mineral adjustment or disinfection before its intended use. Meanwhile, concentrated brine leaves the system through a separate discharge line.
For suppliers, reliable design starts with local feed data, not salinity alone. Temperature, turbidity, and intake conditions can change energy use and cleaning frequency. Containerized equipment saves installation space, but it cannot make poor feed data disappear. A practical design should allow operators to inspect filters, record pressure changes, and adjust cleaning schedules. I would still question any estimate based on one water sample; coastal conditions rarely stay perfectly still.
A 35–45% recovery rate is a useful starting point when comparing containerized seawater desalination systems. It means roughly 35 to 45 cubic metres of product water may be made from every 100 cubic metres of feedwater. Actual performance depends on salinity, temperature, membrane condition, and operating pressure. The number is not a guarantee. Even a small change in seawater quality can shift the result.
Energy use around 3–4 kWh per cubic metre is another practical benchmark for reverse-osmosis designs. Ask whether the figure includes intake pumping, pretreatment, and energy-recovery equipment. A value measured only across the high-pressure pump can look reassuring, but it may understate the site’s total demand. Check the test conditions, too. Warm, relatively clean seawater is not the same as a turbid coastal intake after heavy rain.
For supplier comparisons, request a performance curve, a sample water analysis, and clear limits for feedwater quality. Look closely at pretreatment details: cartridge filters, chemical dosing, and cleaning access matter inside a compact container. Ask how the unit handles membrane flushing and what spare parts operators should keep on site. One weakness in many comparisons is that headline figures receive more attention than maintenance conditions. That is easy to miss, and worth reconsidering. A well-documented system may prove more dependable than one with a slightly better advertised number.
China’s containerized seawater desalination suppliers typically offer more than a reverse-osmosis skid. Product scope may include seawater intake screening, cartridge filtration, chemical dosing, high-pressure pumps, membrane racks, and post-treatment. Inside a standard container, equipment is arranged around pipe access, drainage, ventilation, and service clearance. Some packages add energy-recovery devices, remote monitoring, and automatic flushing; others list these as optional items. Details matter.
Compare feed-water assumptions, rated output, recovery rate, power demand, and product-water targets on the same basis. Ask whether quoted capacity reflects ideal feed water or seasonal coastal conditions with algae and suspended solids. Container dimensions alone reveal little about installation scope. Intake pipelines, outfall arrangements, foundations, lifting access, and electrical interfaces may remain outside the package. That boundary is easy to miss. A useful technical offer identifies materials, operating limits, consumables, commissioning support, and maintenance intervals. Even a polished proposal can leave uncertainty around fouling and spare parts. Request layout drawings and test conditions, then review unresolved details with an independent water-treatment engineer.
Comparing suppliers requires more than reading a rated output on a brochure. Check whether capacity is stated for actual seawater conditions, including temperature and salinity. A unit listed at 500 cubic meters per day may deliver less during seasonal changes or maintenance. Ask for operating data from comparable coastal sites, plus energy use per cubic meter and expected recovery rate. Small details matter.
Membrane technology affects pretreatment needs, cleaning frequency, and water quality. Request membrane specifications, replacement intervals, and test results for boron and total dissolved solids. Certifications can indicate that quality systems and equipment have been assessed, but verify their scope and validity. A certificate alone does not prove reliable field performance. Look for commissioning records, service response times, and references from plants that have operated for several years. Comparisons are not always neat; site conditions can distort them.
Tips: Ask each supplier for the same feedwater assumptions and a clear list of exclusions. Check container dimensions, lifting points, corrosion protection, and access for replacing filters. Confirm who handles operator training and spare parts. If answers feel vague, pause. One weakness in this checklist: paper records may not reveal how a system performs during a difficult season, so speak directly with operators when possible.
Selecting a containerized seawater desalination supplier requires more than comparing nameplate capacity. Ask what “guaranteed output” means: daily permeate volume, water quality, and operating hours under specified feed conditions. Record seawater salinity, temperature, and turbidity in the contract assumptions. Request a clear acceptance test and a remedy if results fall short. Small details matter.
Energy figures need the same scrutiny. Confirm whether quoted consumption includes intake pumping, pretreatment, high-pressure pumps, and product-water transfer. Compare kilowatt-hours per cubic meter at your expected salinity, not an ideal test site. Ask for readings at partial load, too. A spreadsheet can look reassuring while leaving out auxiliary equipment; I would not treat that number as settled until the measurement boundary is clear.
Lifecycle cost includes more than the purchase price. Estimate membrane replacement, filter media, chemicals, specialist visits, shipping, and planned downtime over several years. Check which parts are stocked locally and how long routine maintenance takes. Request assumptions behind each estimate, then test them against your own operating schedule. Some forecasts will still be rough, especially where feedwater quality changes by season. That uncertainty deserves a line in the budget.
Supplier-neutral procurement checklist: This table compares ten technical and commercial evaluation dimensions—not named suppliers or a supplier ranking. Reference ranges are indicative and must be checked against the project’s feedwater, site conditions, and stated system boundaries.
| No. | Evaluation dimension | Useful reference or context | Evidence to request | Selection check |
|---|---|---|---|---|
| 1 | Guaranteed net water output | Capacity should be stated as usable permeate delivered at the specified product-water quality—not merely nominal membrane capacity. | Guaranteed output in m³/day, feedwater design conditions, operating hours, and a witnessed performance-test procedure. | Confirm the guarantee applies at the project’s actual seawater temperature, salinity, and seasonal conditions. |
| 2 | Feedwater salinity and temperature | Open-ocean seawater is often around 35 g/L total dissolved solids, but local salinity and temperature can differ substantially. | Design envelope for salinity, temperature, turbidity, and other relevant feedwater parameters; identify any excluded conditions. | Compare the design basis with representative site data, including seasonal extremes—not only a single average sample. |
| 3 | Recovery rate | Seawater reverse-osmosis systems commonly operate at roughly 35–50% recovery, subject to feedwater quality, pretreatment, and concentrate-disposal limits. | Guaranteed recovery, feed and concentrate flows, and the assumptions used for scaling and fouling control. | Check that the quoted recovery is sustainable for the site and does not rely on excessive chemical dosing or unrealistic cleaning intervals. |
| 4 | Specific energy consumption | Modern seawater RO systems may fall broadly around 3–6 kWh per m³ of permeate; reported values depend on design and measurement boundaries. | Guaranteed kWh/m³ at a stated output and feed condition, plus a complete list of included equipment and auxiliary loads. | Verify whether intake, pretreatment, product-water pumping, post-treatment, and container HVAC are included. Compare systems on the same boundary. |
| 5 | Operating pressure and energy recovery | Seawater RO commonly uses high-pressure feed in the approximate range of 55–70 bar; actual pressure varies with salinity, temperature, and membrane design. | Pressure range, pump efficiency, energy-recovery arrangement, and performance data at the stated design conditions. | Request operating—not just maximum—pressure and check that energy-consumption figures correspond to the proposed configuration. |
| 6 | Product-water quality | Permeate quality depends on the feed, membrane system, and post-treatment. There is no single universal TDS value that substitutes for a project specification. | Guaranteed product-water limits for TDS or conductivity and any required parameters such as boron, hardness, pH, or microbiological quality. | Define the intended use and applicable local requirements. If water is for drinking, include suitable remineralization and disinfection where required. |
| 7 | Pretreatment and membrane protection | A commonly specified RO-feed target is SDI15 ≤ 3, subject to membrane requirements and the selected pretreatment process. | Pretreatment process description, RO-inlet SDI and turbidity targets, chemical-dosing basis, and cleaning triggers. | Confirm the feed-quality limits are achievable at the site and that pretreatment equipment is included in the quoted package. |
| 8 | Container footprint and site interfaces | Typical ISO container external dimensions are approximately 6.06 × 2.44 × 2.59 m for a 20 ft container and 12.19 × 2.44 × 2.59 m for a 40 ft container. | General arrangement drawing, transport weight, lifting points, maintenance clearances, utility connections, and installation requirements. | Check transport access, foundations, corrosion exposure, ventilation, drainage, and whether all quoted equipment fits within the stated package boundary. |
| 9 | Lifecycle cost and consumables | Whole-life cost includes electricity, pretreatment media, chemicals, cartridge filters, membrane replacement, cleaning, labor, and concentrate management. | Cost model with stated electricity price, annual operating hours, replacement assumptions, chemical consumption, and service requirements. | Compare lifecycle costs using the same project life, energy price, output, and system boundary. Separate quoted costs from assumptions. |
| 10 | Availability, warranty, and acceptance test | Output and availability guarantees are contract-specific; they should not be inferred from a product description or a short factory demonstration. | Warranty scope and duration, exclusions, spare-parts list, response times, commissioning plan, and site acceptance-test protocol. | Define remedies for missed output, energy, or quality guarantees, and specify how performance will be measured after installation. |
A common design reference is about 35 grams of dissolved salts per liter. It is not a fixed value. Tides, rain, and river flows can change it.
Screens and filters remove suspended particles before water reaches the membranes. This helps limit fouling. Fine silt can still be easy to overlook.
High-pressure pumps push feedwater through semi-permeable membranes. Water passes through, while most dissolved salts remain behind. Concentrated brine exits through a separate line.
No. It may need mineral adjustment or disinfection for its intended use. The required treatment depends on the application.
Ask them to state their assumptions for salinity, temperature, and feedwater conditions. Request operating data from comparable coastal sites. One sample is a thin basis.
Check actual capacity, energy use per cubic meter, and expected recovery rate. Ask for membrane specifications and test results for boron and total dissolved solids.
Check its dimensions, lifting points, corrosion protection, and filter access. Confirm who provides training and spare parts. A tight service hatch can become a real nuisance.
No. Verify each certificate’s scope and validity, then ask for commissioning records and service response times. Speak with plant operators when possible. Paper records miss things.
This article introduces the fundamentals of seawater desalination, including the typical salinity of seawater at approximately 35 g/L and the role of seawater reverse osmosis (SWRO) in producing fresh water. It also outlines common design benchmarks: recovery rates of about 35–45% and energy consumption of roughly 3–4 kWh per cubic meter, while noting that actual performance depends on feedwater conditions, system design, and operating practices.
The overview of China’s Containerized Seawater Desalination suppliers focuses on comparing product scope and practical capabilities rather than names alone. Buyers can assess systems by production capacity, membrane technology, certifications, and relevant project experience. Before selecting a supplier, they should also examine guaranteed output, expected energy demand, maintenance needs, and lifecycle costs to determine whether a unit is suitable for its intended site and operating conditions.